Why Every Contractor Needs a Business Dashboard
Most contractors we work with can quote a kitchen gut to the dollar but cannot tell you what their close rate was last quarter. Heading into the spring 2026 bidding season, that gap is the single most expensive blind spot in a small contracting business. The numbers that decide whether you survive are not in your accountant's quarterly statement. They are five quick reads that decide whether the slow leaks turn into the flood that takes most construction companies under before year ten. Fewer than 15 percent of construction owners regularly look at them, according to Construction Business Owner magazine. The ones who do tend to make the most money in their market.
What kills construction businesses is rarely the work
Up to 96 percent of construction companies fail before reaching their 10-year mark, according to the U.S. Department of Commerce. The Bureau of Labor Statistics puts it slightly differently: only about 36 percent of construction businesses started since 2011 were still operating a decade later. Either way, the odds are brutal.
The number one killer is not competition or bad luck. According to a widely cited U.S. Bank study, 82 percent of small business failures tie directly to cash flow problems. Not revenue problems. Cash flow. The money was there; it just was not visible at the right time.
The pattern is not dramatic. It is gradual. You underbid a few jobs because you did not know your real margins. You do not notice an invoice is 60 days overdue because nobody flagged it. You keep closing at 20 percent and never realize a small adjustment to your estimates could push it to 30. These are not catastrophic events. They are slow leaks that a contractor business dashboard would have caught.
Five numbers worth checking every Monday morning
When contractors hear "track your KPIs," they picture a spreadsheet with 30 columns and formulas they will never understand. That is not what we are talking about. We are talking about a handful of numbers you can read in 30 seconds:
- Revenue this month versus last month, so you can adjust before you fall behind instead of after.
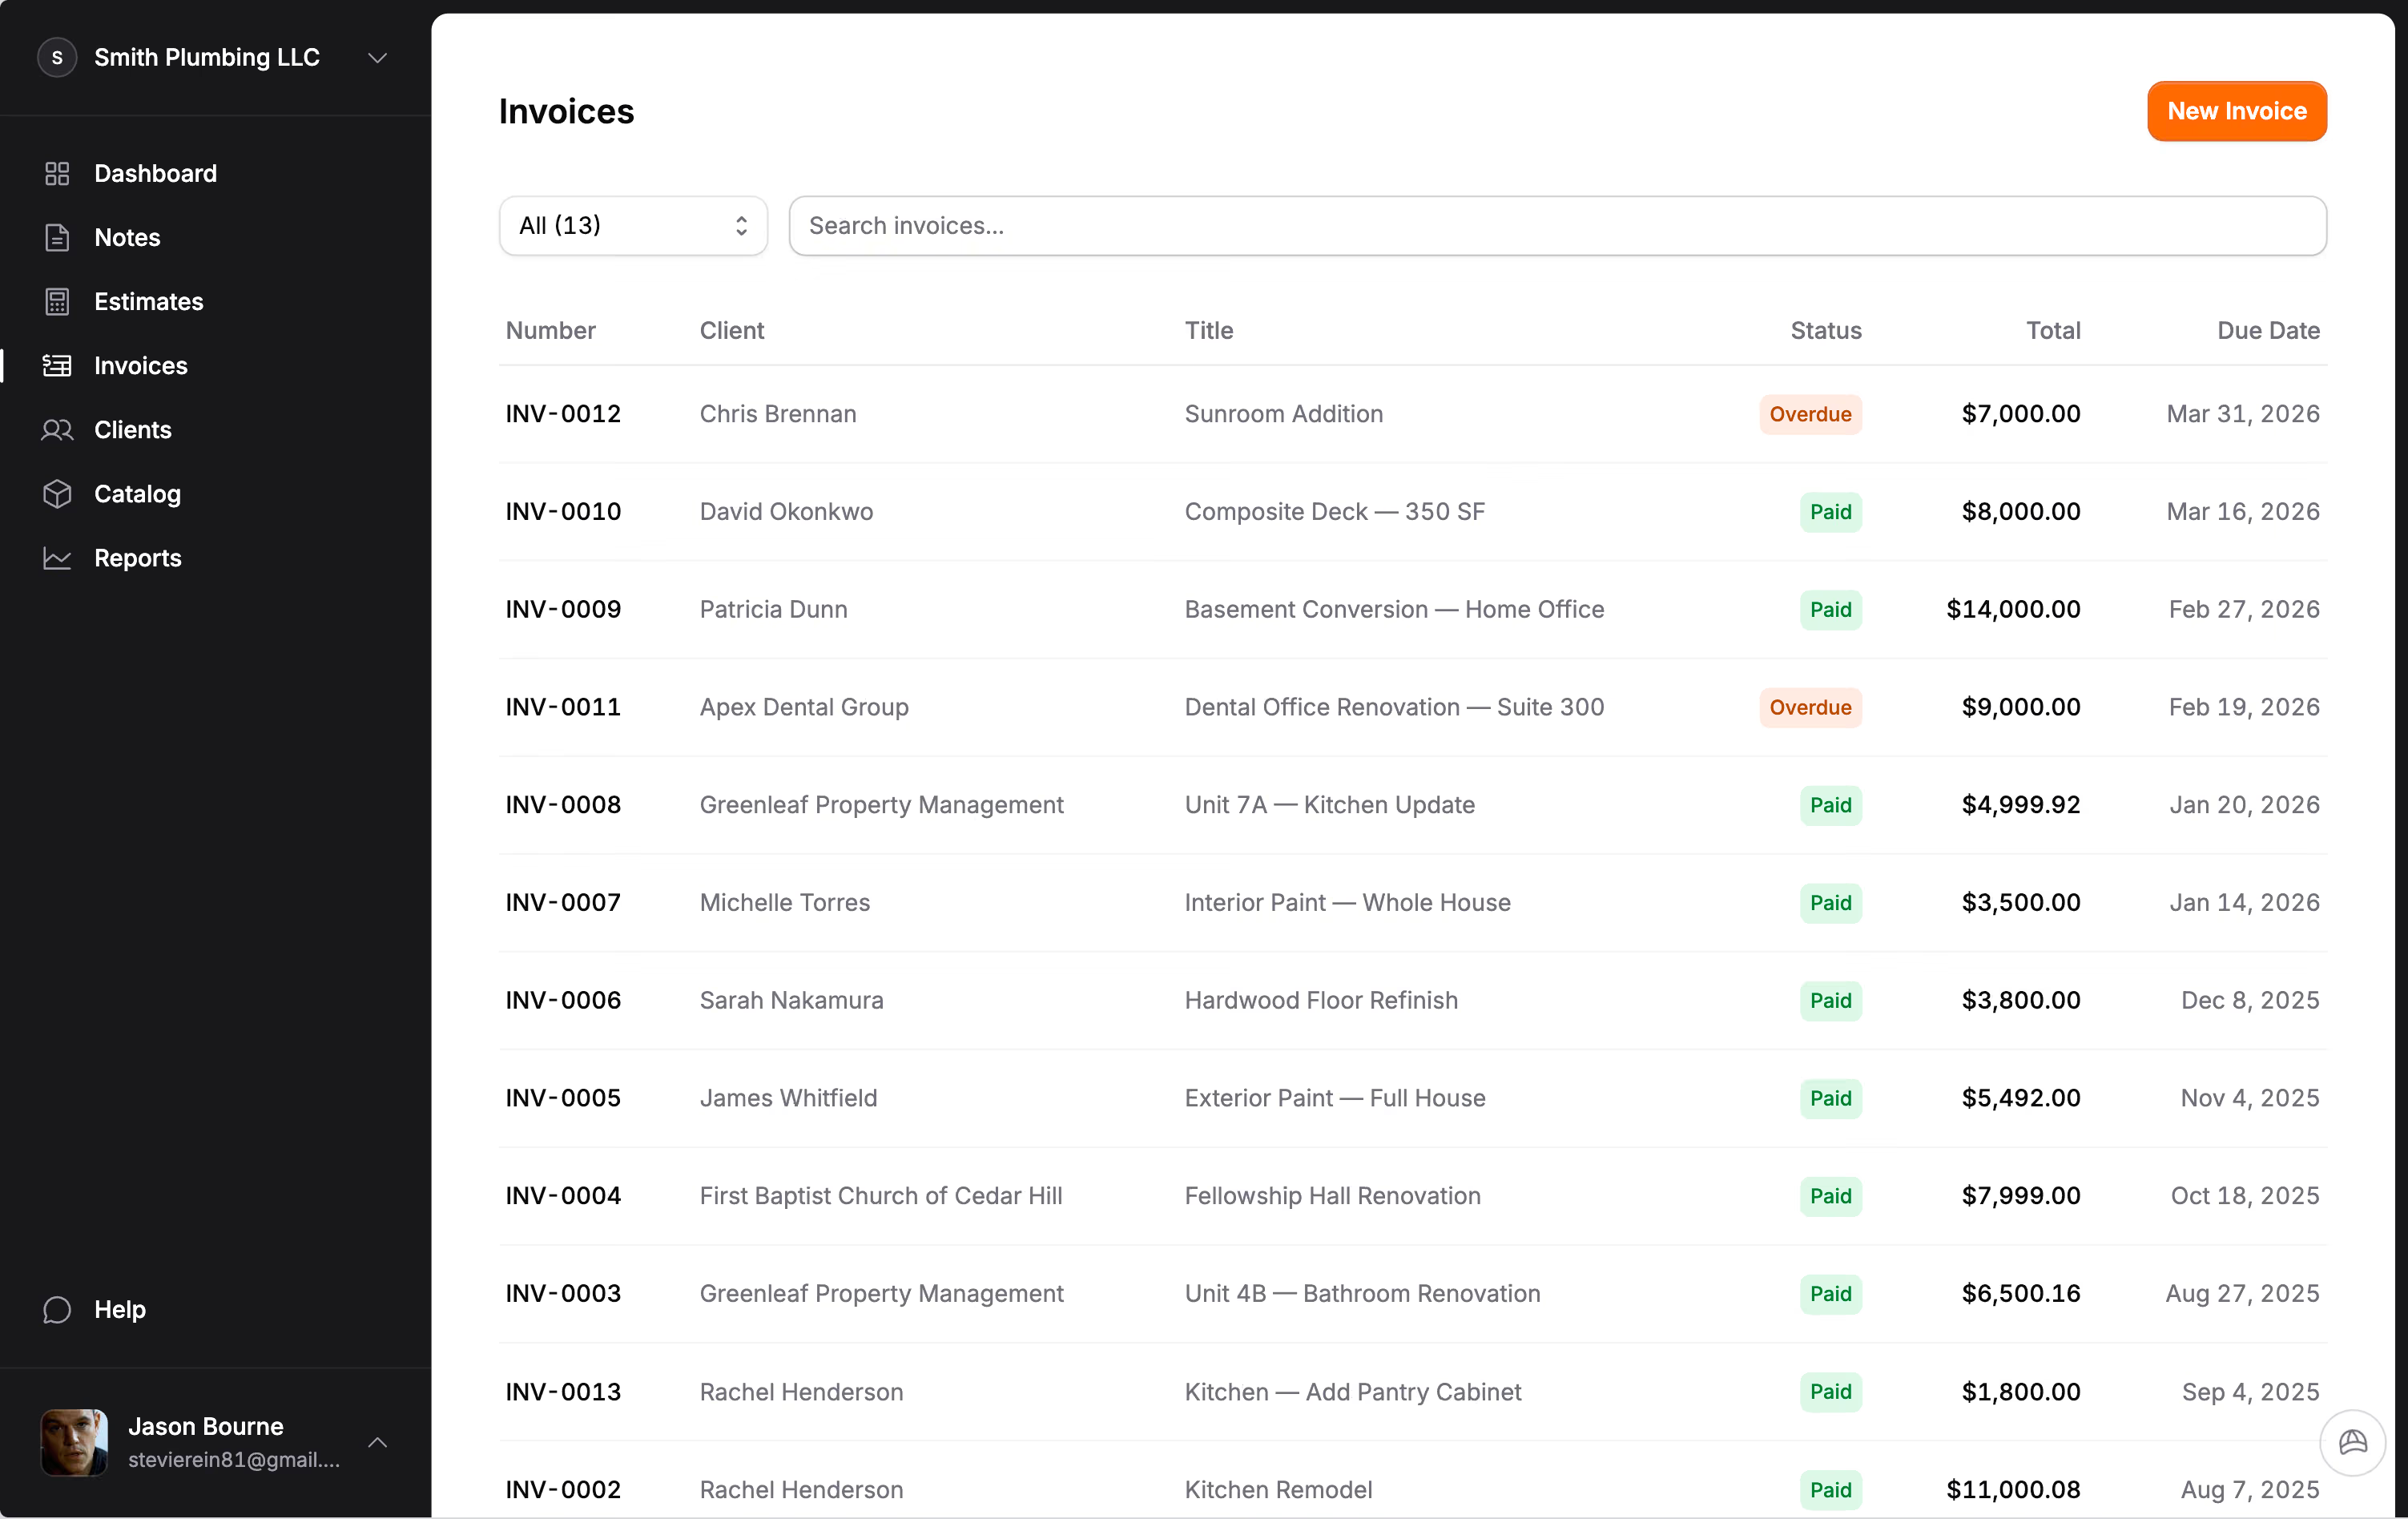
- Total outstanding invoices, so you know exactly how much money is owed to you right now.
- Overdue invoices flagged the moment they cross the line, because catching a late payment at 15 days is a phone call and catching it at 90 is a collections problem.
- Estimate conversion rate, so you stop guessing whether you close 15 percent of your bids or 35 percent.
- Estimates in the pipeline by count and dollar value, so a drying funnel does not catch you off guard two weeks late.
The stakes behind those numbers are real. Rabbet's analysis of construction payment delays found that 82 percent of contractors now wait more than 30 days to get paid, up from 49 percent two years earlier, costing the industry around $280 billion a year. Across the small contractors we talk to, average days sales outstanding sits closer to 60 to 90 days than to the 30-day net term most of them put on the invoice. A dashboard that turns an aging invoice red is not a luxury at those numbers. It is the bare minimum.
These are not accounting metrics. They are business health indicators that any contractor can read between jobs on a phone screen.
The real cost of not knowing your close rate
Here is the math that makes this concrete. Say you send 20 estimates a month and your average job is $12,000. At a 20 percent close rate, you are bringing in $48,000 per month. If you could push that to 30 percent (by following up faster, improving your estimate presentation, or adjusting your pricing), that is $72,000 per month. The difference is $288,000 per year.
You cannot improve a number you do not measure. And most contractors we talk to have no idea what their close rate actually is. They have a feeling. Feelings are not data.
A drywall contractor in eastern Washington told us he had been quoting at what he believed was a 30 percent close rate for two years. When he actually counted, it was 14 percent. Same crew, same prices, same work. The difference between the number he believed and the number that was real had cost him about six figures in misallocated time on follow-ups and slow estimate revisions. He didn't need new bidding software. He needed to see the number once.
The same logic applies to late payments. Across the small contractors we talk to, the gap between when an invoice is sent and when the money lands stretches well past the 30-day net term most of them put on the document. If your invoices are not flagged the moment they go overdue, the money quietly ages from "they'll get to it" to "this might be a problem" to "I need to call a lawyer."
A dashboard is not a spreadsheet
Construction is the second least digitized industry on the planet, just above agriculture, according to McKinsey. Contractors spend 1.5 percent of revenue on technology, compared to 3.3 percent across all industries. The resistance is understandable. Most "solutions" are designed for companies with IT departments.
But a dashboard does not have to mean a spreadsheet, a pivot table, or an accounting degree. It can be one screen you open on your phone while your coffee cools.
The Jobkore dashboard starts with the screen you see the moment you log in: five cards showing this month's revenue, last month, year to date, outstanding balance, and overdue amount. Below that, a 12-month chart showing paid versus outstanding. Below that, your recent estimates and invoices with status badges so you can see what needs attention.
When you need to go deeper, the Reports page breaks it down further: conversion rates, estimates sent, revenue by client, and date range filtering so you can compare any period. Hank's Analysis reads your numbers and gives you a plain-language summary of what is going well, what needs attention, and what to do next.
You are not doing accounting. You are glancing at a screen that tells you whether your business is healthy, and drilling into the details when something needs a closer look.
The contractors who survive know this already
Contractors who consistently track KPIs report 15 to 25 percent higher profit margins, according to Performance Financial LLC. A 2023 Deloitte and Autodesk study found that companies classified as "data leaders" in construction see 50 percent higher profit growth rates than their peers.
The bar is low. Most of your competitors are not tracking anything. Eighteen percent of small businesses admit to not tracking their finances at all. In construction specifically, fewer than 15 percent regularly look at their numbers. Just by checking five metrics once a week, you are ahead of 85 percent of the industry.
You do not need to become a finance person. You do not need to love numbers. You need five cards on one screen, checked once a week, so that the slow leaks never turn into the flood that takes you under. And to be clear, once a week is enough. Daily check-ins are a different kind of avoidance, the same way obsessively refreshing your bank balance was when you were starting out.
If you do nothing else this week, write down on a sticky note the five numbers you would actually want to see if someone handed you a one-page report on Friday. Revenue this month. Total owed to you. Overdue total. Close rate. Pipeline. Then count, by hand if you have to, what those numbers are right now. The exercise takes maybe twenty minutes. Most contractors who do it find that at least one of the five is meaningfully different from what they assumed, which is exactly the point.
You already know how to frame a wall, run conduit, or bid a kitchen gut. The business underneath that work runs on five visible numbers and the willingness to look at them when the answer might not be the one you wanted.
Frequently Asked Questions
What KPIs should a contractor track?
The most important numbers for a contractor are revenue this month, total outstanding invoices, overdue invoices, estimate conversion rate, and estimates in the pipeline. Your dashboard gives you the revenue and invoice snapshot at a glance. The Reports page goes deeper with conversion rates, revenue by client, and Hank's Analysis to summarize trends. You do not need complex accounting metrics. Just a few numbers, checked weekly.
What is a good profit margin for a contractor?
General contractors typically see gross margins of 12 to 16 percent, while specialty contractors average 15 to 25 percent. A healthy net profit margin for a well-run contracting business is 5 to 10 percent. The industry average pre-tax net income sits around 6.3 percent of revenue. If you are not tracking margins per job, you cannot know where you stand.
Why do most construction companies fail?
Up to 96 percent of construction companies fail before their 10-year mark. The primary cause is cash flow mismanagement, responsible for 82 percent of small business failures according to a U.S. Bank study. The failures are rarely sudden. They result from gradual issues like underbidding, slow collections, and not tracking financial metrics.
How do contractors track their finances?
Most contractors use a combination of spreadsheets, paper records, and memory. Fewer than 15 percent regularly track their financial numbers. Contractors who do track KPIs consistently report 15 to 25 percent higher profit margins. A simple dashboard showing five key metrics replaces the spreadsheet with something you will actually check.